
Knowledge is power.
Information is power.
Infographics are like magic tricks for data—they take complex information and turn it into visually captivating stories that anyone can understand. With icons, charts, and illustrations, they break down data into bite-sized pieces, making it accessible to everyone. Whether it's for educational purposes, marketing campaigns, or data-driven reports, infographics are the secret sauce for enhancing data storytelling and improving comprehension.


Infographics for
Technological Concepts
Always On, Always Connected PC. I took on the challenge of illustrating ARM's 'Always On, Always Connected PC' technology evolution. My infographic condensed data into a cohesive visual that embodied ARM's brand identity, playing a central role on our website and in presentations, effectively conveying this groundbreaking concept.
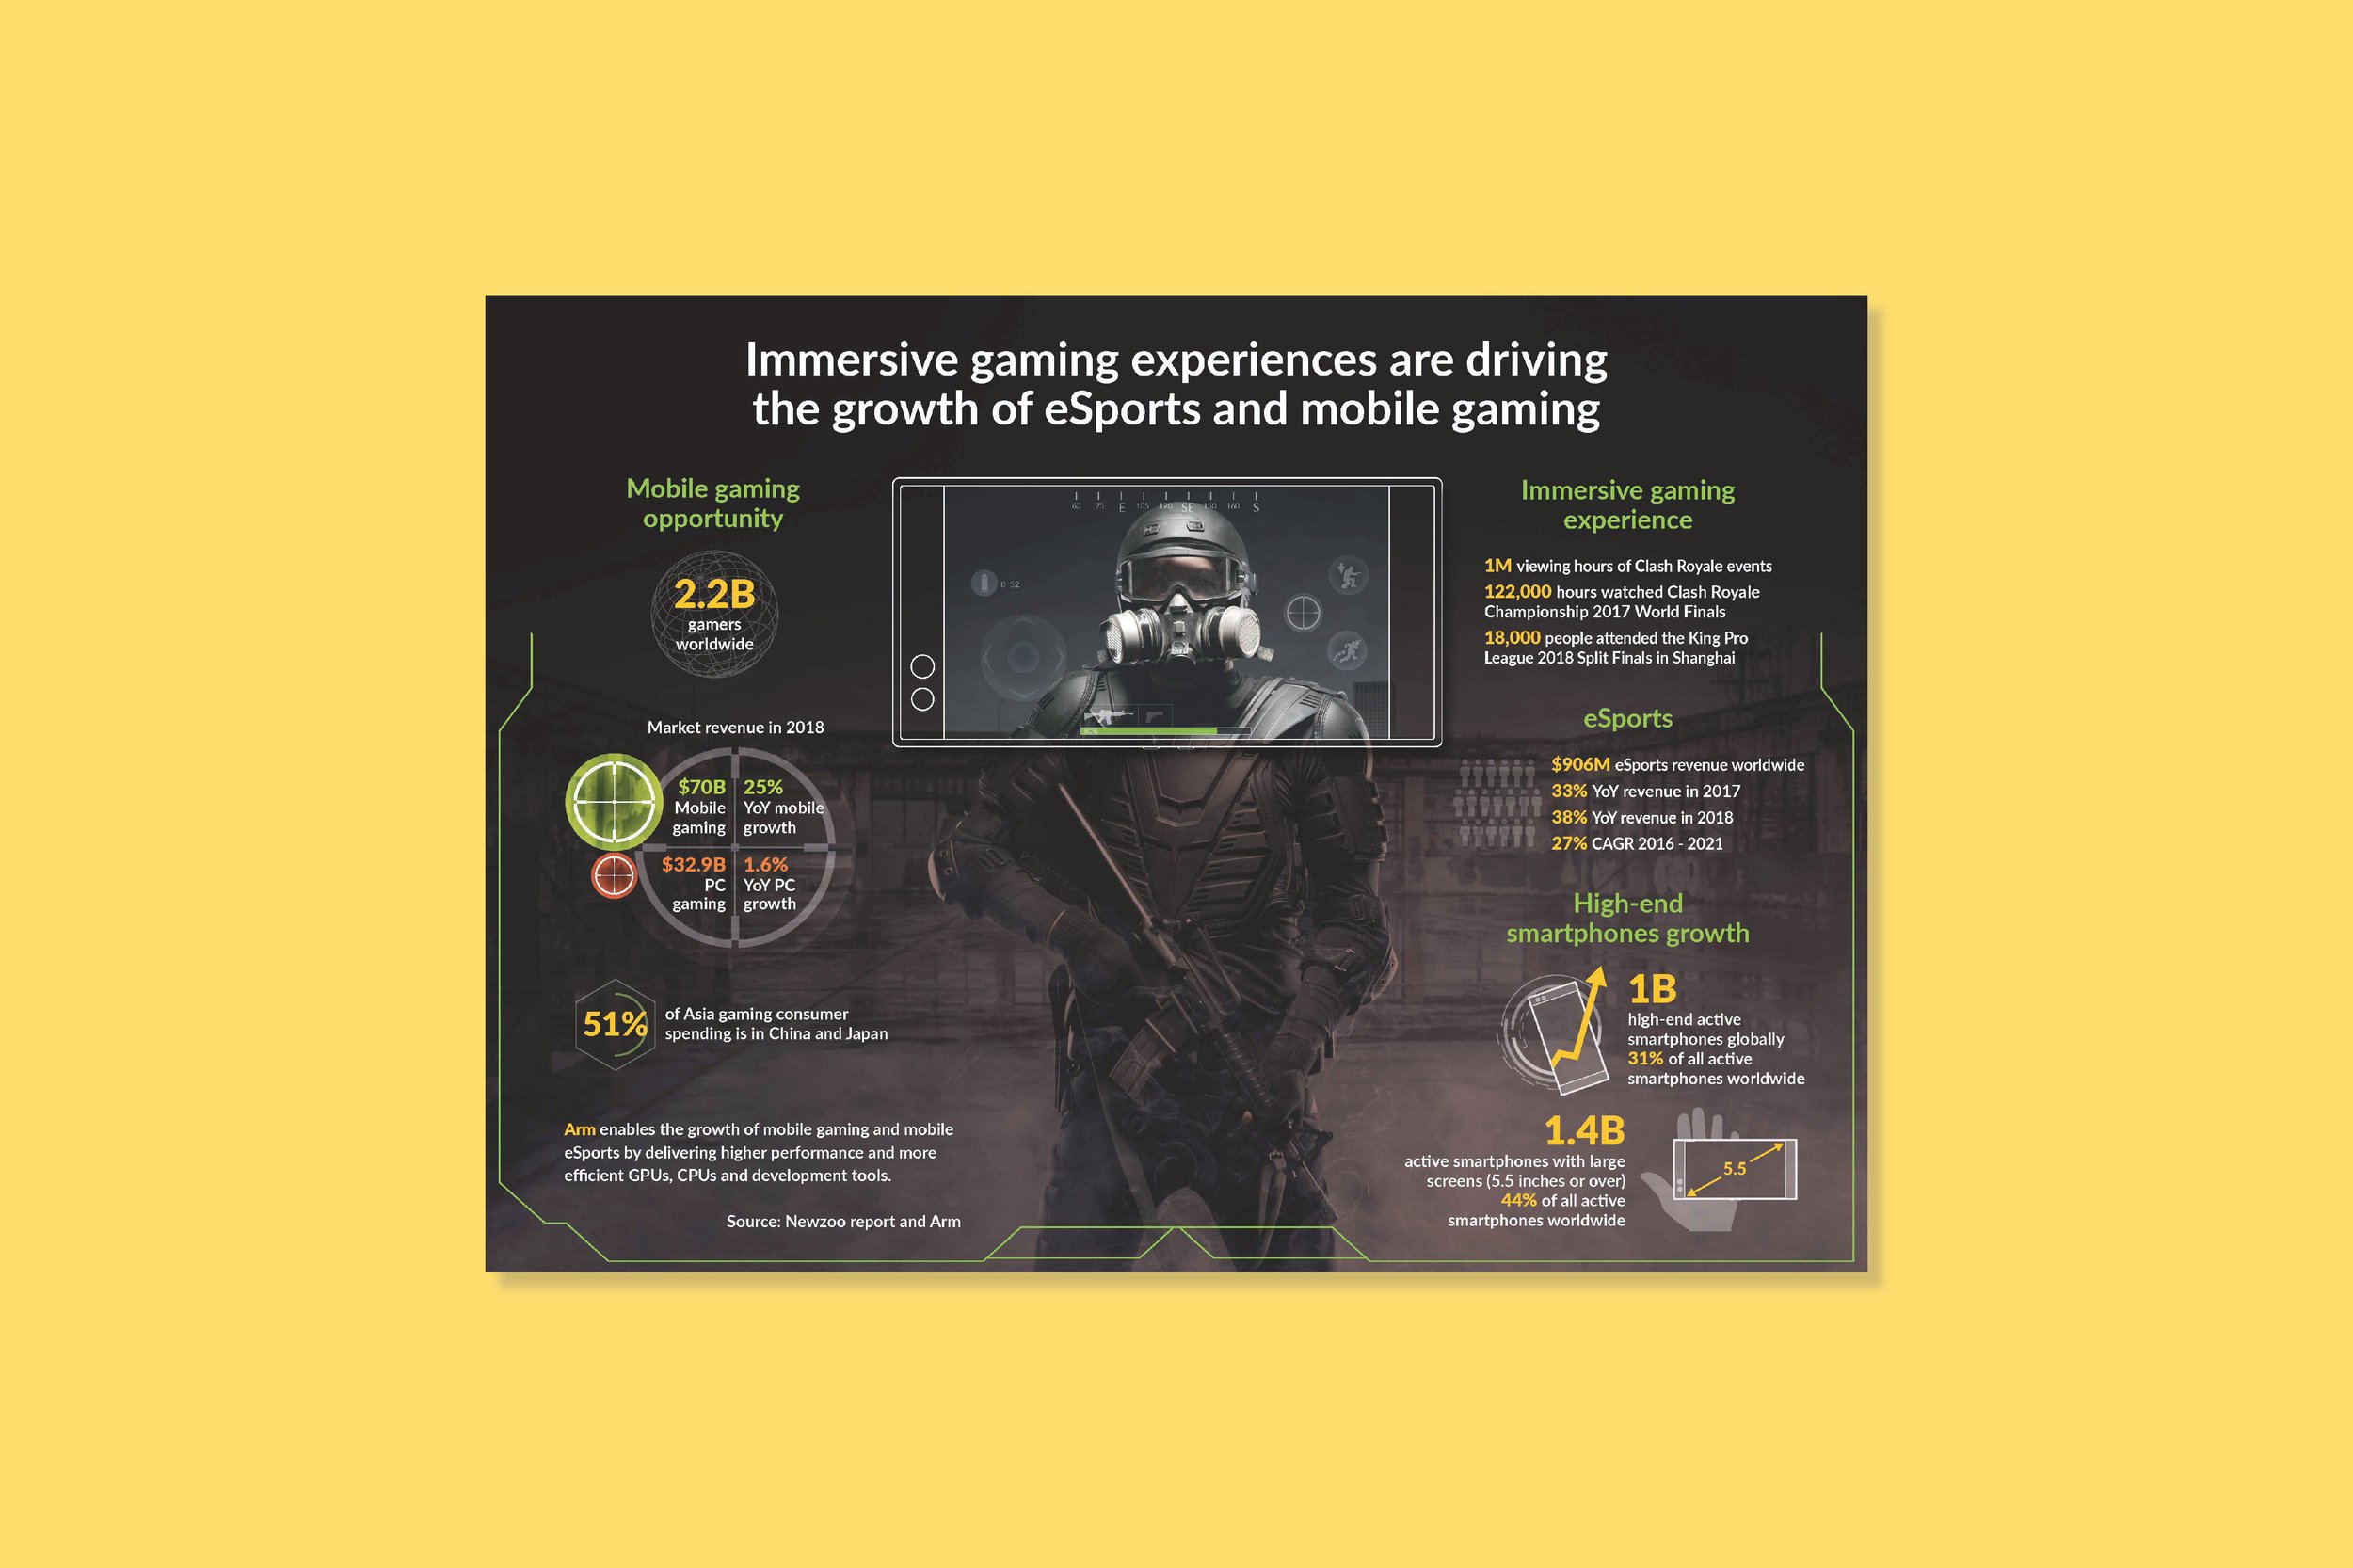
Mobile Gaming Infographics. My task was to dive into the world of eSports and Mobile Gaming, shaping immersive experiences into captivating infographics. Skillfully integrating data, statistics, and insights, I aligned them with ARM's unique brand identity, resonating with the eSports industry. These infographics took center stage in presentations and handouts, successfully communicating the evolution of eSports and Mobile Gaming.

REAL System VR
QSG and IFU
In the realm of emerging technology, like the Rehabilitation VR from REAL System, device setup can often be complex, leading to questions and uncertainties. To address this, I focused on creating both Quick Start Guides (QSGs) and detailed User Manuals. A Quick Start Guide helps users swiftly initiate their new product, simplifying the setup process, while a User Manual offers in-depth insights into every aspect of the product or service. Together, they ensure users can confidently navigate our innovative technologies.

ARM Presentation
Inforgraphics
Simplifying Complex Technology: Our infographic, created under the Arm brand, offers a smart solution for explaining the intricate Arm Pelion IoT platform. It's designed to minimize text and rely on visuals, making it easy for presenters to guide their audience through the technology without getting bogged down in wordy explanations. With this approach, we've tackled the challenge of simplifying complex concepts and ensuring our audience can effortlessly understand Device-to-Data connectivity.